
On August 5th, 2011, representatives of the S&P rating agency announced their decision to downgrade their credit rating of the US Federal Government.
To be fair, the S&P had clearly flagged their thinking earlier on, announcing a negative outlook back in April of the same year.
Still, it was a historical decision. For the first time ever, the US government’s credit rating fell below AAA.
Unsurprisingly, the markets shuddered. The following Monday, August 8th, the S&P 500 index had lost roughly 6% of its value, declining all the way to 1,119.
Sitting at my desk in London as a freshly minted investment banker, I shuddered as well.
A few months earlier, I maxed out our student loans and invested the money in US index funds. Needless to say, I was freaking out.
Are we going to have another collapse, GFC-style?
Is our money gone?
And to make things even worse, will I lose my job as well?
Crystal Ball
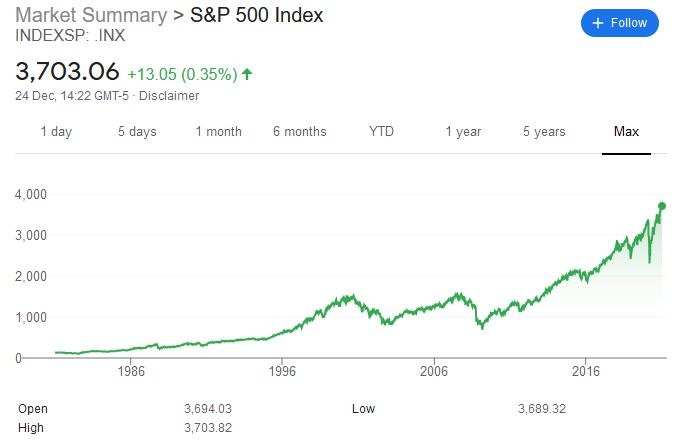
As I write these words almost a decade later, the S&P is hovering around the 3,700 mark.
Since that day in August 2011, the index has delivered an annualized price return of about 13.5%.
Those readers who know how to deconstruct stock market returns will know that there’s also about 2% of annual dividend return to be factored in.
In hindsight, my worries back then seem almost nonsensical.
They do, however, illustrate a fundamental flaw of human nature when it comes to investing:
We are very good at imagining the downside – because we’ve been there before.
It’s easy to look at the market’s historical performance and imagine that at some point, we will retrace our footsteps on the way down:
Sadly, what we are NOT very good at is conceptualizing the future.
The waters ahead are uncharted. We’ve never been there before – so we don’t know what’s to come.
How many of you walk around imagining the S&P 500 crossing the 4,000 level?
Or 5,000?
Or 10,000?
I certainly don’t.
And yet, this is exactly where the magic money machine is heading:
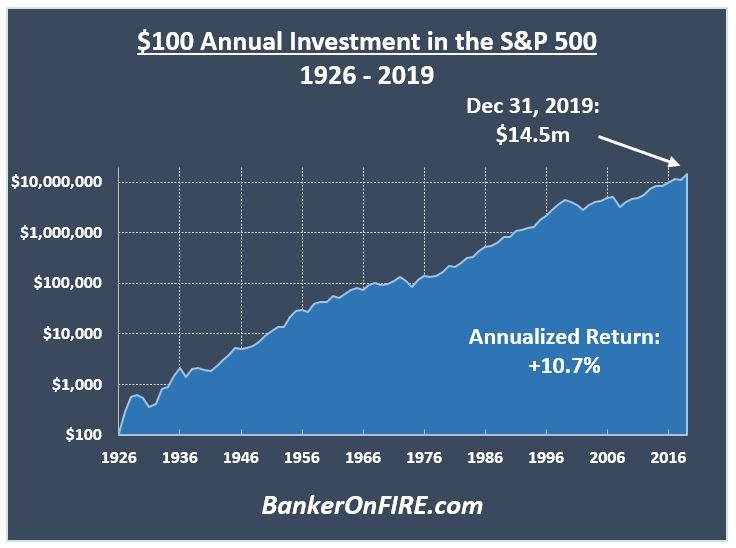
There were plenty of reasons to worry along the way
In fact, if you are 40 or younger, there’s a high likelihood you will see the S&P 500 cross 40,000 at some point in your lifetime.
Skeptical?
Well, consider the following.
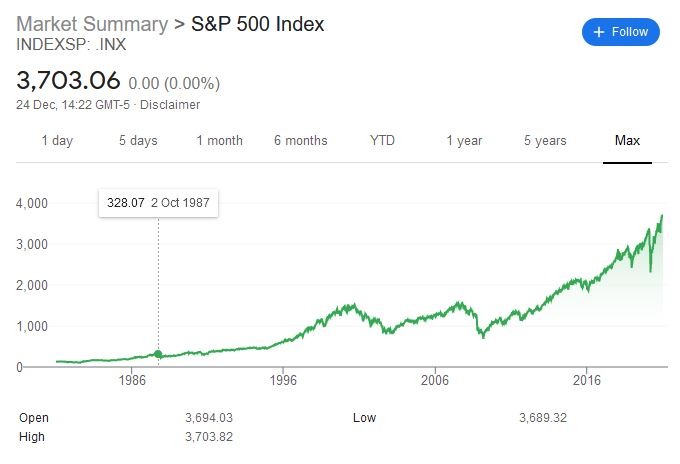
Just before the October 1987 crash, the S&P stood at about 300. Yes, that’s not a typo. We are not missing a digit there.
To be precise, the S&P 500 was at 328.07 on October 2nd, 1987.
If you had told someone back then that in about three decades, the index would hit 3,700, they would probably laugh you out of the room.
If you did that three weeks later, after the market dropped 20%, chances are they would have punched you in the face.
And yet, that’s exactly what happened. Here’s that same chart, with October 1987 clearly marked for reference:
What Happens Next?
I have no idea what the market will do this year. Or the next year. Or the year after that.
What I do know is that the stock market is one of the best gauges of human progress there is.
And if you believe in humanity’s long-term prospects, you should also believe that equities will continue their relentless (if volatile) march upwards.
Let’s put some numbers around it for context.
The chart below shows where the S&P 500 will be in ten years assuming a range of return rates:
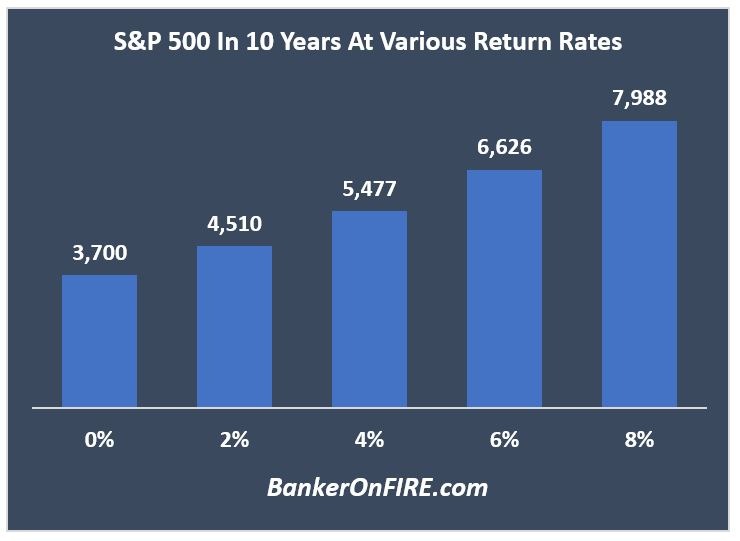
Assuming the stock market doesn’t budge (could happen), we’ll still be at 3,700.
But even at a meager 2% price return, the S&P will easily cross 4,500.
And if it performs slightly below historical levels and delivers a 6% return (before dividends), we could easily be approaching the 7,000 mark.
But that’s not where it ends.
A Truly Long-Term View
As my experience shows, decades come and go – and it happens much faster than we expect.
If you are just starting out your investing journey, it will probably take you about 20 years or so to start eyeing the finish line.
Here’s where the stock market could get to in that time frame:
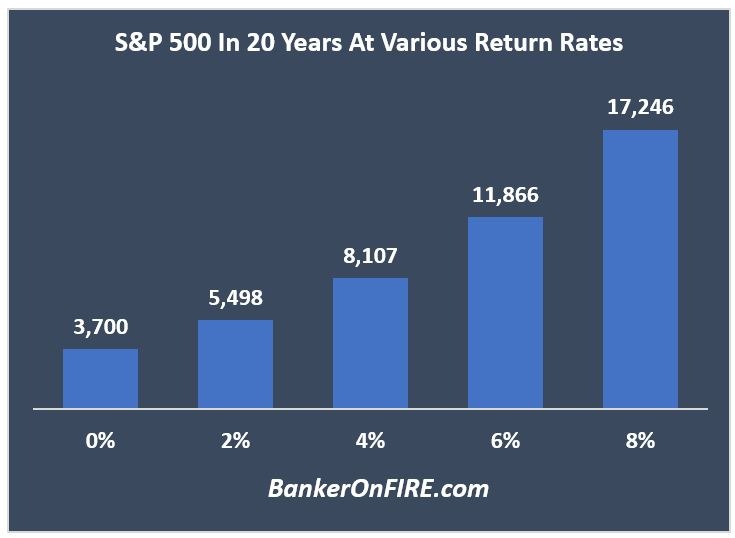
Now is a good time to ask yourself – when the S&P 500 is somewhere between 12,000 and 18,000, will it really matter that you invested at 3,700 and not 3,000?
Nope.
What would make a difference, of course, is worrying about valuations, elections, pandemics, trade agreements, and everything else that’s going on – and missing out on the ride altogether.
And because I like to take a really long-term view on this blog, let me leave you with one final chart:
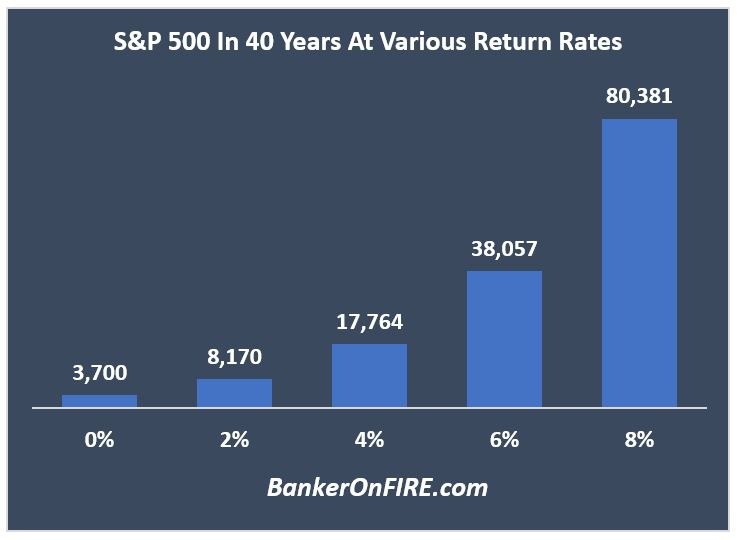
Yes, the numbers speak for themselves.
I am sure we all wish we could go back in time to 1980 and buy the S&P at 130.
Sadly, that option is no longer available. But provided you have the time (and the patience), you’ve got an equally awesome opportunity to get in today.
Happy investing!
About Banker On Fire
Enjoyed this post?
Then you may want to sign up for our exclusive updates, delivered straight to your inbox.
You can also follow me on Twitter or Facebook, or share the post using the buttons above.
Banker On FIRE is an M&A (mergers and acquisitions) investment banker. I am passionate about capital markets, behavioural economics, financial independence, and living the best life possible.
Find out more about me and this blog here.
If you are new to investing, here is a good place to start.
For advertising opportunities, please send an email to bankeronfire at gmail dot com