Not too long ago, one of my readers posed an interesting question in the comments section of this blog.
Essentially, it boiled down to this:
I am using the stock market for long-term wealth building and my goal would be to FIRE, hopefully, within 15-20-25 years.
I have recently read the book “Your Money or Your Life”. The following caught my eye:
Over the past ninety years, the stock market has taken five big hits (32 to 86 percent) with recovery times afterward ranging from four to twenty-seven years:
- Great Depression: down 86%, 27 years to recover
- Mid 1970s: down 47%, almost a decade to recover
- Late 1987: down 32%, 4 years to recover
- Great recession, 2007 – 2009: down 50%, 6 years to recover (or 14 years if you count from the matching dot-com peak in 1999)
I am aware that market cannot be timed, that I should diversify, that I can allocate more to stocks if there are significant number of years ahead of me.
I am also aware of the fact that if I am in for the long-term, I can come out of downturns (even use them as a buying opportunity) and get a nice average.
But still for some reason this gets me worried. What if history repeats itself and we get into a heavy market downturn which takes 10/20/30+ years to recover?
FIRE doesn’t really work anymore…does it? Is it reasonable to worry about this?
As a matter of principle, I try to answer all the questions I get, even if I don’t get to them right away.
But this one happened to be so meaty, that I decided to dedicate a separate post to it.
So here’s one for Jon and anyone else who may be pondering the same question.
Setting The Stage
First of all, this is an entirely reasonable question to ask. The whole point of risk assets such as equities is that investing in them happens to involve, well, risk.
In this specific context, it’s the risk of losing your principal, which in turn negates all the hard work and sacrifice you’ve been making and jeopardizes your retirement prospects.
The way to address concerns with risk is not to ignore it or hide from it.
Instead, it is to evaluate the risk-reward proposition of an investment and decide whether it fits your personal investment objectives.
The second point to make is that no one can predict the future. When it comes to the stock market, we use past performance to anticipate future results.
Historical data sets are helpful, but they suffer from multiple limitations that reduce their relevance. No one knows how the stock market will perform going forward.
However, the question here is about a repeat of a crisis similar to what we’ve experienced in the past.
With that in mind, let’s take a closer look at what these past crises looked like – and what it felt like to actually live through them.
The Right Benchmark
I haven’t read the “Your Money Or Your Life” book that Jon references, though I did hear good things about it.
Regardless, there are two fundamental questions we need to answer in order to address Jon’s concerns.
Question 1: What is the benchmark the author uses to gauge the performance of the stock market?
Is it the S&P 500? The Dow? The FTSE 100 / 250? Or yet another index?
In an ideal world, we would look at the historical performance of a world equity index, weighted by market capitalization of its constituents.
Alas, we don’t live in an ideal world.
While world equity indices do exist now, they’ve only come to the fore about 30 – 40 years ago. That’s not nearly enough time to generate a big enough data sample.
As such, in order to assess the stock market’s performance over long periods of time, most investment books turn to one of two US indices.
One is the Dow Jones Industrial Average (aka “The Dow”). The other one is the S&P 500.
The Dow goes back all the way to 1896. The S&P 500 goes back to 1926 (though it only included 90 stocks back then).
In theory, we should all be using the Dow, on account of it having been around for much longer than the S&P 500.
However, the Dow happens to be a price-weighted index. This presents a problem because it leads to an imperfect representation of returns.
As an example, if the lowest-priced stock in the Dow increases in price by a dollar and the highest-priced stock declines by the same amount, the Dow won’t change.
Unless you hold one of each stock, your personal return would actually be either positive or negative. (For most people, it will be positive because usually we solve for amounts to be invested in each stock as opposed to solving for a number of shares).
In addition, the Dow only includes 30 stocks. That’s simply not sufficient for a broadly diversified equity portfolio you want to hold.
The S&P 500 holds a much broader universe of stocks and is market-weighted, which solves the problems above.
Question 2: What is the metric the author uses to gauge the performance of the stock market?
Is it the price return? Or is it the total return, which also includes reinvestment of dividends?
As I’ve written about here, the biggest mistake retail investors make when it comes to stock market investing is comparing the headline index numbers.
For example, the graph below illustrates the difference in S&P 500 returns with and without reinvestment of dividends:
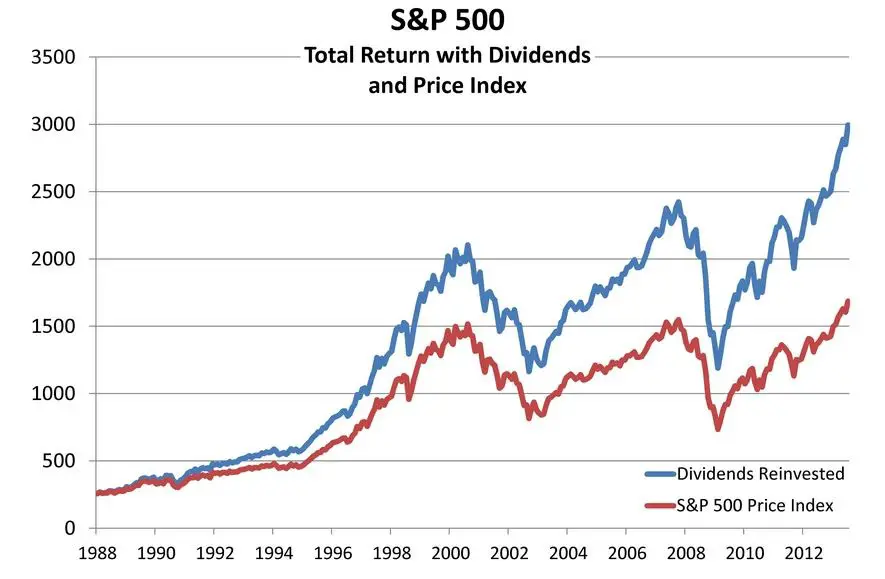
Unless you cash out your dividends every single time you receive them, you should be looking at the blue line, not the price index denoted by the red line.
Historical Performance: Dow Jones vs. S&P 500
Based on the numbers the author of the book is quoting, I am pretty confident she is referring to the Dow Jones. Have a look at the picture below, courtesy of MarketWatch:
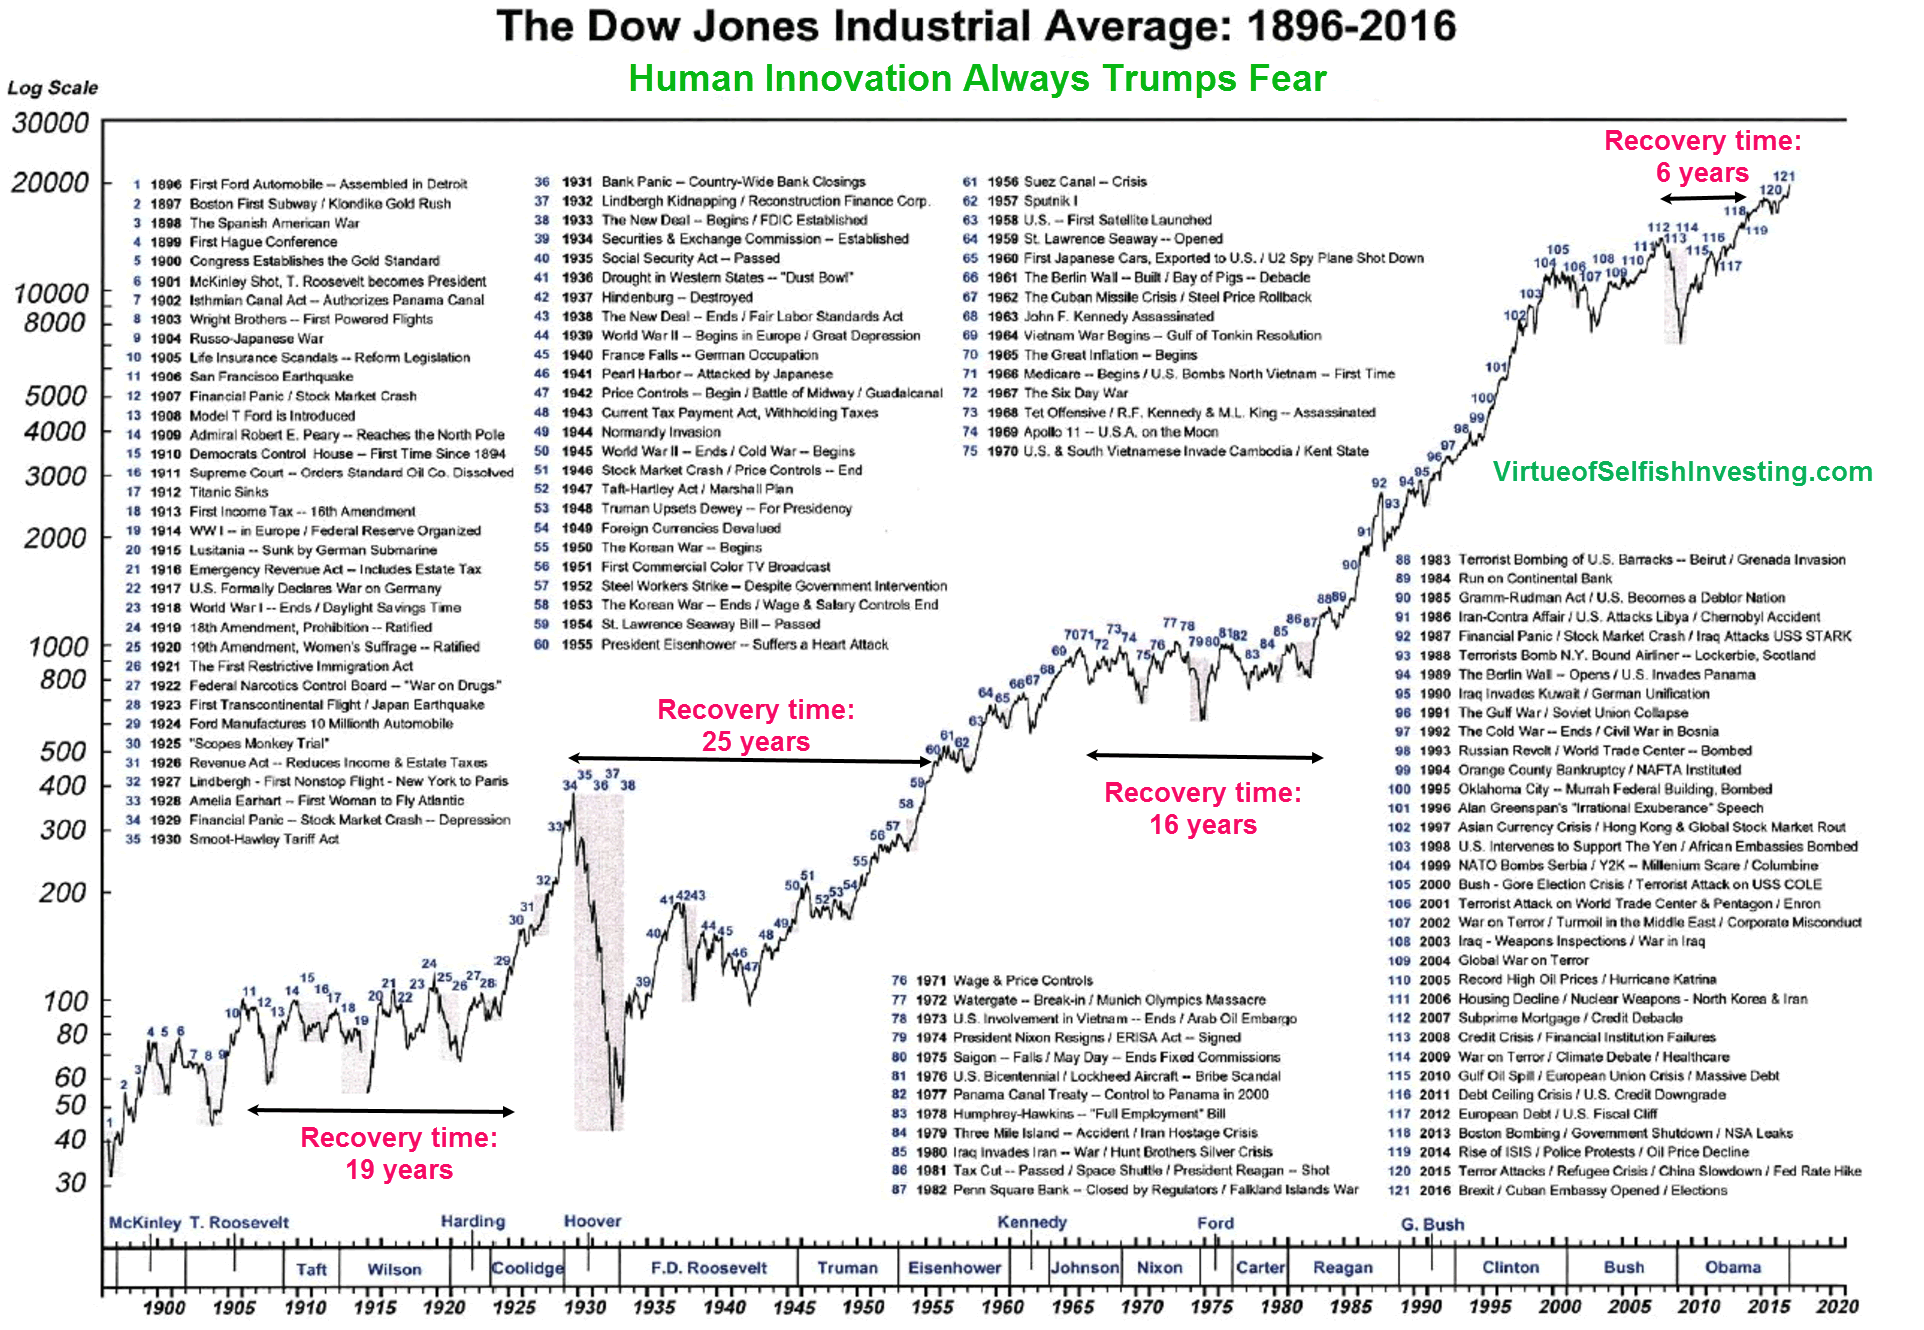
Source: Marketwatch
Indeed, there have been four massive corrections, ranging from 6 to 25 years in length. The article goes into additional detail on each of those, should you be a fan of horror stories.
However, that misses the point entirely.
As I mentioned above, holding just 30 US stocks in your portfolio is something you should NEVER do. Instead, you should be invested in a nicely diversified world equity tracker with thousands and thousands of quality companies located around the world.
There’s also a case to be made for investing purely in US equities, which is what I do. But even then, holding anything less diversified than the S&P 500 is pure madness.
So instead of looking at the Dow, let’s have a look at how the S&P 500 has performed since inception.
Sadly, I couldn’t find an off the shelf graph of how the index has performed over time, so I created one from scratch based on the data set from Slickcharts.
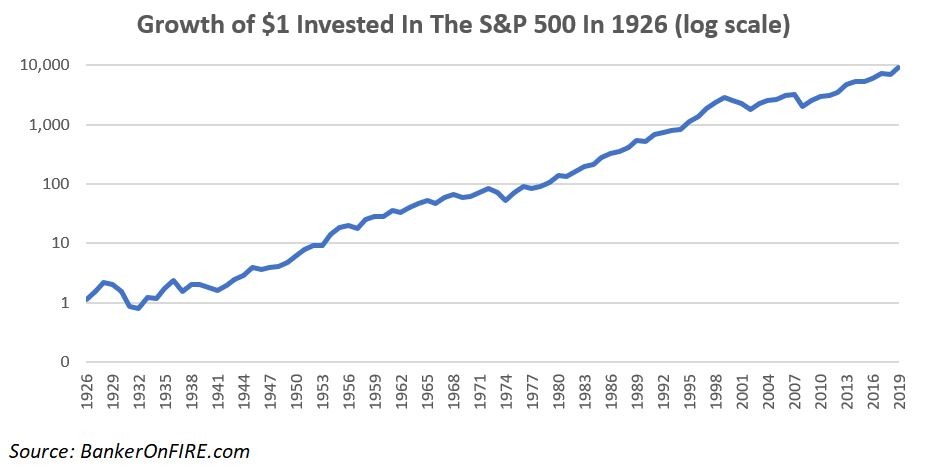
Have a good look at the chart above. What you will see is that:
- The Great Depression was a nasty event, but recovery took just 7 years. That is, even if you put all your money into the S&P 500 on January 1, 1929, you would have recouped all of your losses (and then some) by the end of 1936.
- The 1970s weren’t pretty either, but you were more than whole by end of 1976. Just four years of pain.
- In 1987, the S&P 500 actually squeezed a 3% gain for the year. So much for Black Monday.
- After the dot-com bubble, the S&P 500 took about 7 years to recover.
- In the Great Recession, it would take you 5 years (i.e. from 2008 to 2012) to recoup your losses.
Lump Sum vs Real Life
Another important clarification is in order here.
The way stock market graphs like the ones above are typically presented is based on a lump sum investment.
That is, you chuck a dollar/pound/euro into it at inception way back when and watch it grow.
In reality, no one ever builds their portfolio this way.
Instead, you set a monthly contribution, direct it into your stock market vehicle of choice, and chug along for the next 20 / 30 / 40 years.
Thus, going through a major correction actually gives you a chance to dollar cost average down. Essentially, you end up buying the index at a discount – and benefitting when prices eventually recover.
This is yet another very important reason why looking at headline index numbers is misleading.
With that in mind, let’s have a closer look at what it would feel like to live through two of the nastiest corrections in the S&P 500 in the past century.
Example 1: Investing In The Great Depression
Let’s assume for the moment you were one of those unlucky souls to start piling into the market in 1929.
In January 1929, you would have invested your first $100 in the S&P 500. Incidentally, that year wasn’t even that bad, with a net decline of 8%. You end up with $92 by the time December rolls around.
1930 was a nastier one. The market is down another 25%, so notwithstanding having invested another $100, your portfolio is only worth $144 by the end of that year.
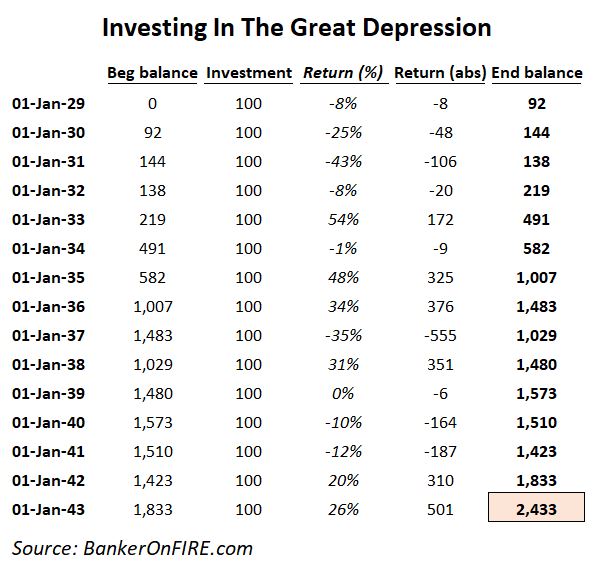
You are now $56 in the hole – but it’s about to get worse because in 1931, the market takes a 43% beating, followed by yet another 8% decline in 1932.
Naturally, you don’t feel that great about your investing journey at this point in time. But over the next four years, the market returns 54%, -1%, 48%, and 34%.
By the end of 1936, you’ve almost doubled your money – all by staying the course.
Below is a snapshot of how your portfolio value compares to the total investment you’ve made: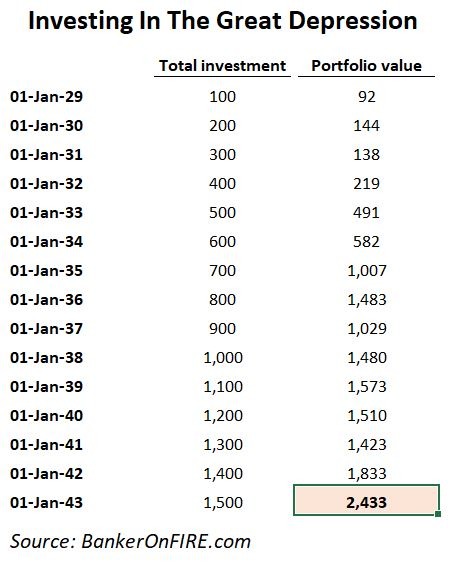
There are some other wobbles coming up, but provided you keep at it for 15 years, you will have invested $1,500 in total – and your portfolio will be worth $2,433.
This works out to an annualized (nominal) return of 5.3%. Not too shabby for picking the worst ever time to invest.
Below is the chart that shows your trials and tribulations over this 15-year investment journey.
Yes, there is a very uncomfortable five-year stretch (1929 – 1934) when your portfolio is underwater.
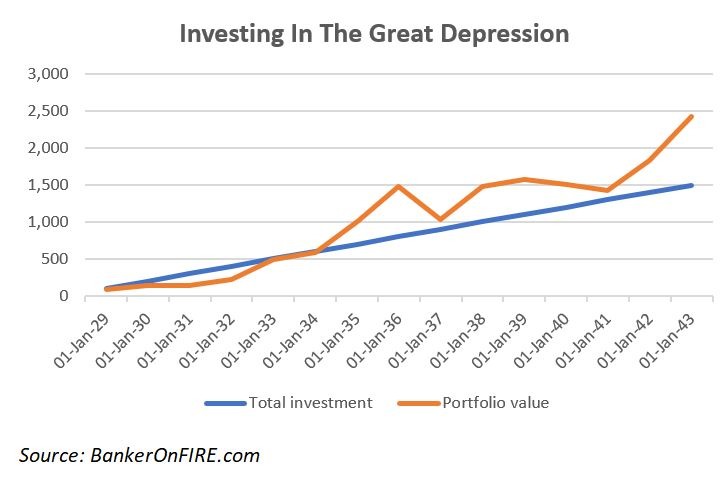
But provided you keep dollar cost averaging – and reinvesting your dividends – your portfolio then roars back, and there’s no stopping you now.
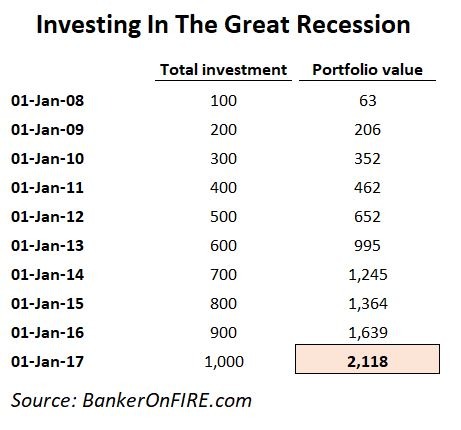
Example 2: Investing In The Great Recession
By comparison, the Great Recession / Global Financial Crisis of 2008 can seem like a walk in the park.
If you had just started investing in January 2008, you would take a nasty drawdown of 37% right off the bat.
At the end of the year, your $100 investment would only be worth $63.
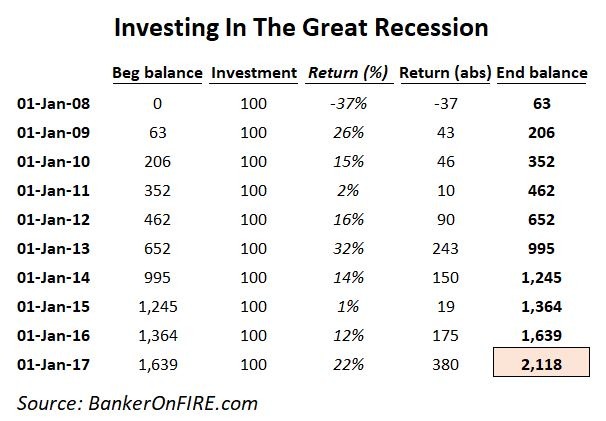
But over the following nine years, the market notched up nine consecutive gains, ranging from 1% to 32%.
Assuming you kept investing, your portfolio would not be out of the money post 2009.
Now, of course it didn’t feel that way back then. Unlike the Great Depression, this is a crisis I’ve actually lived – and invested through.
You can trust me when I say it wasn’t as comfortable as the numbers make it look. Everyone expected knew a further meltdown was just around the corner.
Watching the business news for more than 5 minutes was enough to make your pulse hit 160 and fingers automatically reach for the “SELL” button.
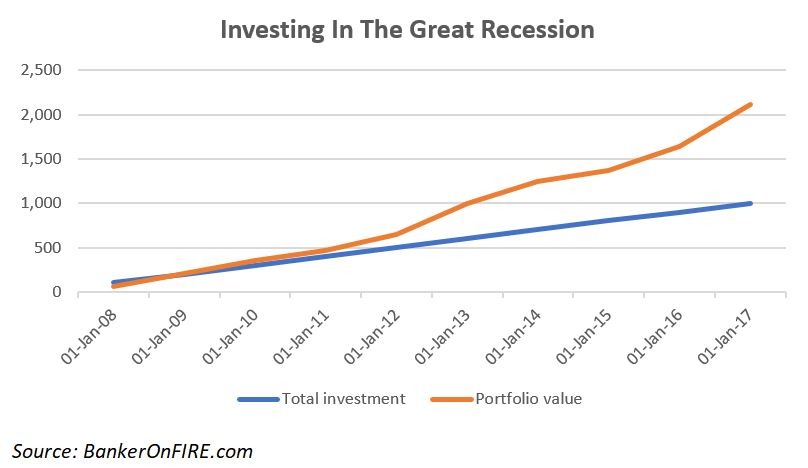
Of course, as we now know, those who held their nerve (and I’m proud to say quite a few BoF readers did!), made out handsomely:
The Bottom Line
There is no doubt that major stock market corrections can and do disrupt the growth of your portfolio.
Sometimes, it can feel like taking a pummelling from Mohammed Ali himself, watching your equity investments decimated in a relentless assault of lightning-fast punches.
There is, however, a way to protect yourself, and it’s quite simple. All you need to do is follow the steps below:
- Save a healthy portion of your income
- Come up with an asset allocation that reflects your risk tolerance and investment horizon
- Invest in a broadly diversified index tracker
- Make regular contributions
- Reinvest dividends
- Prosper
That’s all there is to it.
Happy investing!
PS: I have uploaded the file with the underlying data here.
Should you be so inclined, feel free to play around with it to see what going through other crises would feel like.
About Banker On Fire
Enjoyed this post?
Then you may want to sign up for our exclusive updates, delivered straight to your inbox.
You can also follow me on Twitter or Facebook, or share the post using the buttons above.
Banker On FIRE is an M&A (mergers and acquisitions) investment banker. I am passionate about capital markets, behavioural economics, financial independence, and living the best life possible.
Find out more about me and this blog here.
If you are new to investing, here is a good place to start.
For advertising opportunities, please send an email to bankeronfire at gmail dot com
Great article BoF!
What occurs to me is that the time of when you start to drawdown on your FIRE pot is fairly crucial. Does this influence returns?
I am early in my FIRE journey, so I won’t worry too much about it! I will just keep making regular contributions!
Thanks Alex.
My take is that by the time you start drawing down, you should have a few things in place:
1. A cushion of cash / bond holdings to take you through a market meltdown should one occur shortly after retirement
2. An ability to flex your spending downwards (i.e. by cutting out things like holidays and other discretionary spend) for a short period of time in the event there’s a market downturn
3. An option to generate a bit of extra income – perhaps through a part-time job or a freelance gig
It doesn’t have to be all three, but a subset / combination of them can certainly help mitigate the impact of a downturn should you get unlucky with the timing of retirement
Interesting stuff and something that has been on my mind.
Would a more realistic example be though to analyze each downturn under the assumption that you had already been in the market for a while (5-10-20 years) when it actually came along? In a way, starting to invest right as a recession begins is the ideal scenario, as you’ll be dollar cost averaging the entire way down, so returns will be magnified by the time the market recovers.
It also hurts more the longer you had been in the market since presumably by that time you would’ve accumulated an amount that you’d expect to possibly return more than you can contribute and start to snowball.
For someone like me (mid-late 20s), an upcoming recession for a couple of years wouldn’t be that bad, as I’d see it as a way of supercharging my returns in some of the upcoming prime earning years and I wouldn’t have that much to lose since I expect to be able to contribute significantly more than I have been able to until now.
You raise an interesting point.
The challenge with modeling something like this is there’s an endless amount of permutations that can occur here. This was one of the reasons I’ve uploaded the spreadsheet so that readers can play around with the numbers that reflect their circumstances.
That being said, I’m not sure it makes a massive difference. Let’s say you had a big chunk tied up in the stock market on January 1st, 2008.
After the financial crisis, it would take you 5 years, through the end of 2012, to recover the “face value” of your portfolio. However, you would then have doubled your money in the next five years. Also keep in mind that you would have been making some respectable returns on your money in the period leading UP to the crisis as well.
In the meantime, you would continue making contributions at lower prices, which would further increase the value of your portfolio.
At the end of the day, it’s all about having a long enough investment horizon – at least 5 years, preferably a decade – which it sounds like you do.
PS: Let me know if you want to run a specific scenario through the spreadsheet and need help navigating it.
Hi BoF / Damian,
Jon here. Many-many thanks for addressing my question in a separate post. Super insightful and explanatory! Made me see things more clearly. Thanks for that!
In the meantime, I have also done some research and arrived at the following:
1. I think the book does not consider dividend reinvestments and DCA (fact that you’ll have the opportunity to buy at a discounted price) indeed, which change the story significantly.
2. The losses cited in the book seem dramatical, but it would be only for the investors that invested all their money (lumpsum) the day before the crash.
This triggered me, so I searched a bit and I found a pretty interesting article about “the worst market timer ever” (someone who only invests at the peak). Results show that even if you ONLY bought at the top of the market (i.e. only on the days before all the major crashes occurred), you still end up with a pretty decent capital and return over the long-term. Key is to hold!
Very interesting article (worth the read, takes 5 min): https://awealthofcommonsense.com/2014/02/worlds-worst-market-timer/
3. After some research, what I came to realize is that what is more worrisome is black swan events, like Japan that never really recovered.
Many thanks again for another awesome article! I love your writing style.
Have a great day!
Thanks a lot Jon, I am very happy you’ve found the post helpful and hope that others will, too.
I quite like the blog you’ve linked to, but haven’t come across this particular post. Great read – thank you for sharing.
Feel free to shout with any other questions you may have!
Interesting point about Japan. I understand the reasons for the crash but have never got to the bottom as to why the Nikkei index never recovered? Ultimately highlights the importance of diversification
This explains Japan’s crash – the book’s worth reading but the documentary does a good job too.
Power conflict between the Central Bank & Ministry of Finance – when I complain about politicians here my (Japanese) husband reminds me of this…
https://www.youtube.com/watch?v=5-IZZxyb1GI
Great read on this rainy day BoF … reaffirmed the generic investment advice of staying the course based on historical data.
The hardest part of course during a crash is holding one’s nerve and it wasn’t pleasant seeing the drop of the those three weeks in March. As well as the quickest drop its also been the quickest recovery.
I listened to a podcast between Pete Matthews (meaningful money blog) and JL Collins (author simple path to wealth) earlier this year (and prior to COVID and the subsequent crash) in which Collins talked about stock market crashes and recoveries. He also mentions that given what the markets have been through over time if they fail to recover from a crash then we will have much bigger things to worry about than our investments.
Thanks Magoo.
I’m a big fan of JL Collins (come to think of it, I really should do a review of his book, which is excellent).
As you say, there’s always a chance of a catastrophic event, but we won’t really care what our portfolio looks like in the midst of a nuclear winter, will we? And spending our whole lives worrying about the nuclear winter is just as pointless…
Buy gold apparently though I’ve never understood this. What are you going to do? Chuck gold bars at the nuclear zombies ??
I’d rather have a bunker and a well stocked tin cupboard personally (and a tin opener)
So it seems 🙂
I’m with you. Incidentally, I’ve got a family member who is a bit of a prepper at heart and apparently has a place to go with his wife and kids if things were going to go that way.
The only response I could muster when I heard that was to say that I hope they’ve got room to accommodate four extra people if need be!